Charts
A chart defines how data from submitted forms will be displayed.
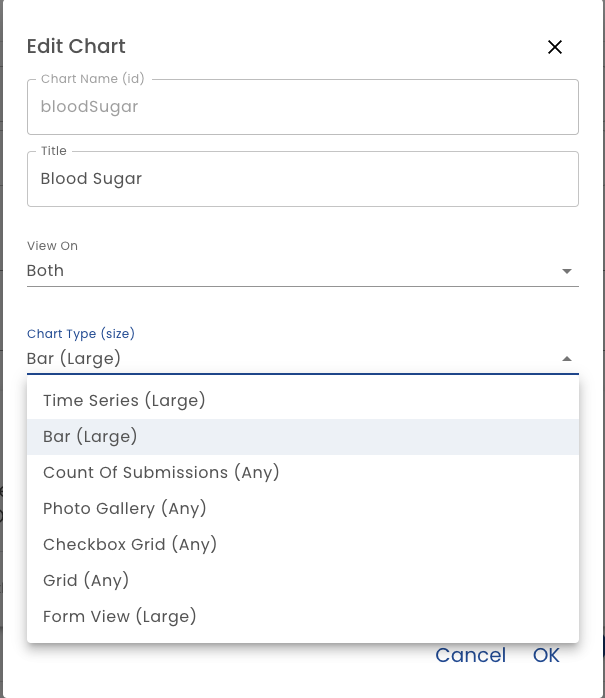
Chart Name - The Chart Name is the identifier of the chart. It should not contain spaces or special characters.
Title - The Title is displayed at the top of the chart
View On - You can select if the chart is displayed on mobile, desktop or both. By default a chart is displayed on both.
Units of Measure - Select one or more units of measure to display in the chart.
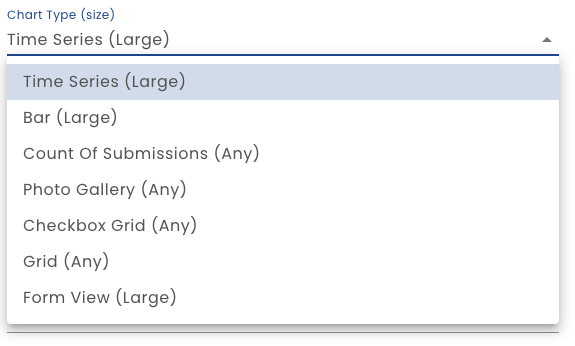
Time Series
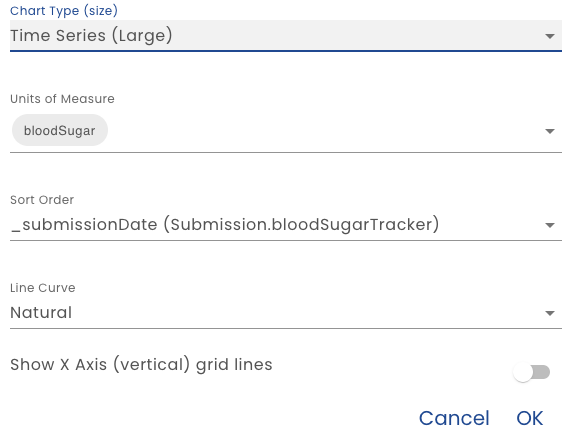
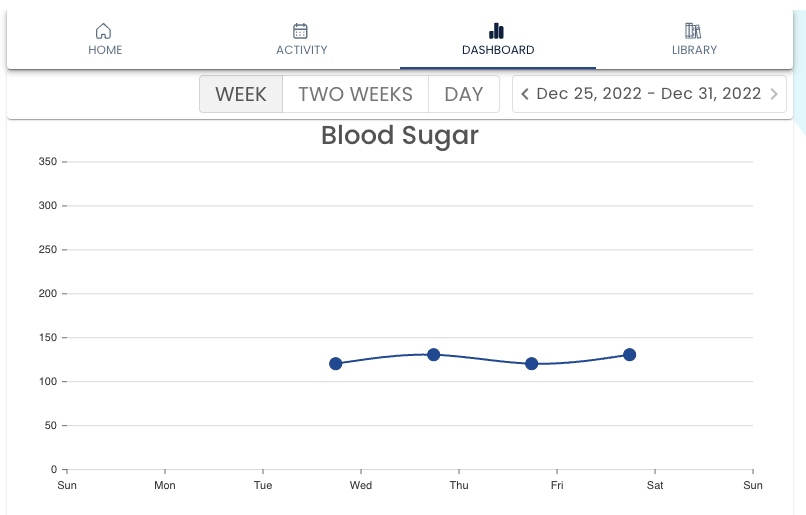
The Time Series options displays charts in a line chart with the date on the X axes. You can select many units of measure or just one. When defining a time series chart, select the date field (sort order), the smoothing algorithm applied and grid lines settings.
Bar Chart
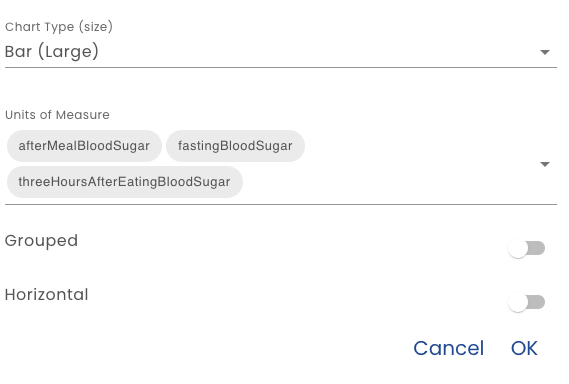
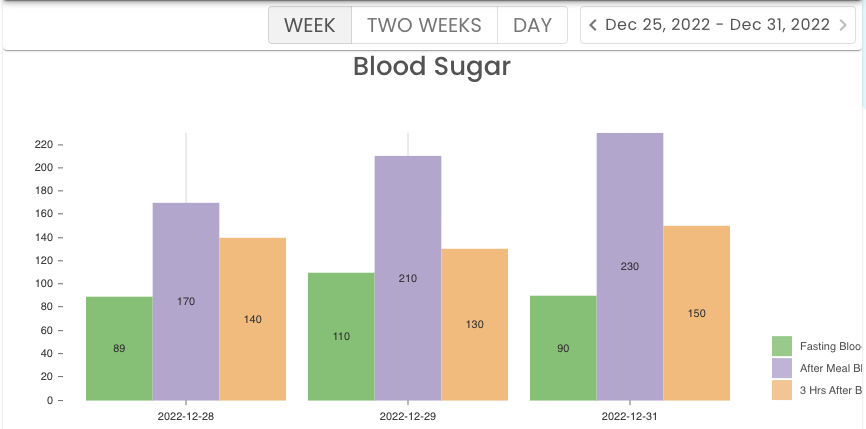
When bar chart option is selected, Grouped and Horizontal may be specified. The Grouped setting determines if the bars show up side by side (as shown below) are stacked. Use stacked when the sum is interesting.
Submission Count
This simple chart simply displays the number of form submissions made in the selected period. It is good for demonstrating engagement. Here it is shown with the Two Charts 1 Big 1 Any layout.
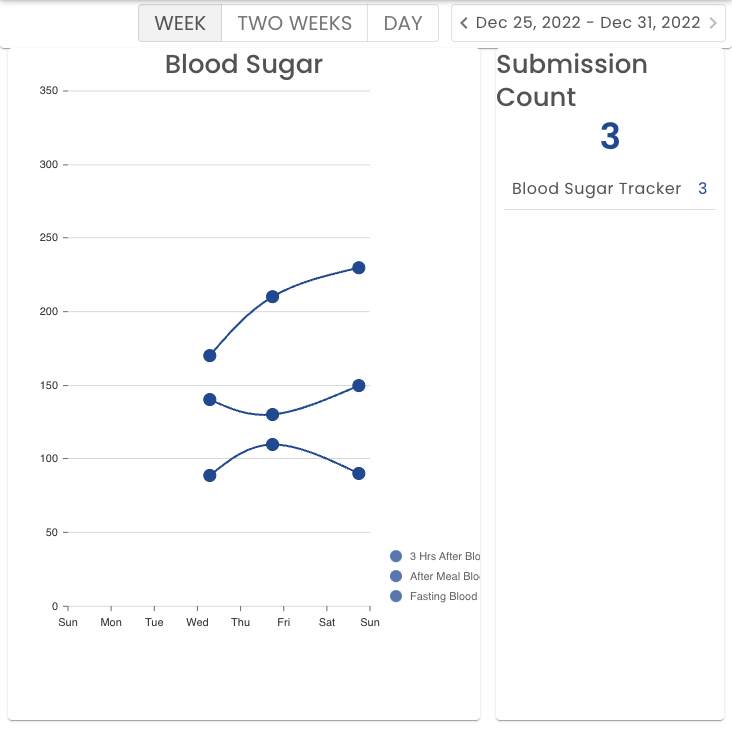
Photo Gallery
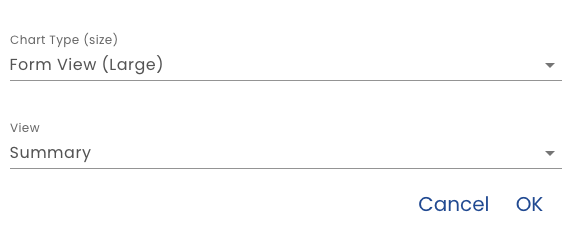
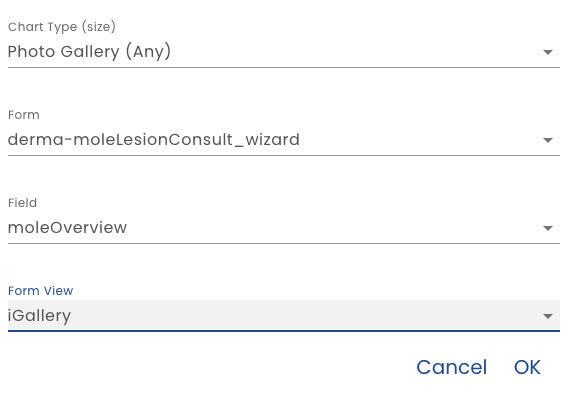
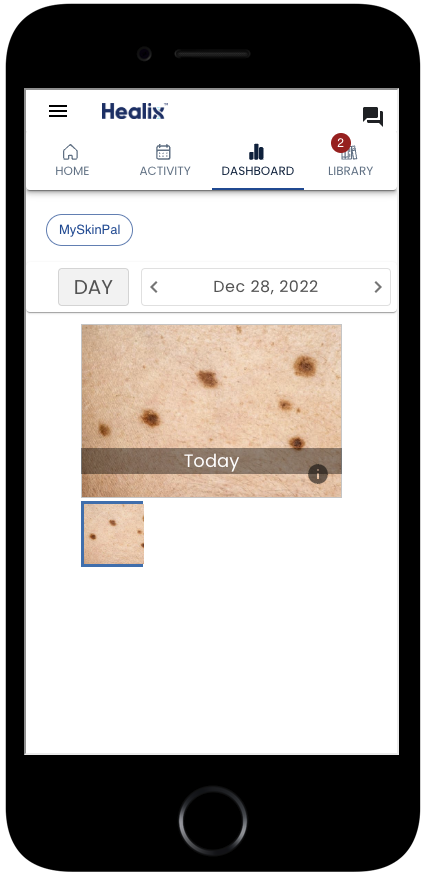
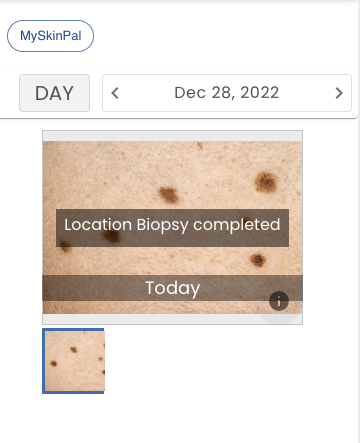
Displaying images uploaded by users can also be done with a chart. When using a Photo Gallery chart type, also specify the form that contains the image upload feature and the upload field name. A Form View selection allows you to specify text from the same form submission that will be overlaid on the image when the info (i) is clicked. Select a view defined in the Views section.
Checkbox Grid
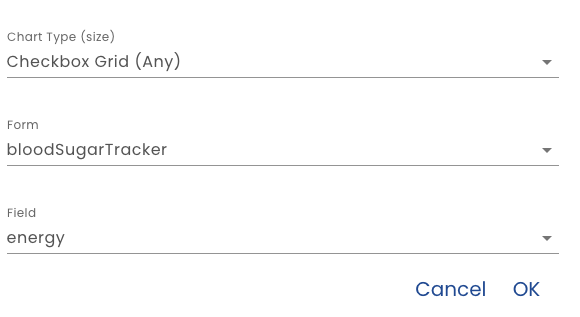
Configuring a Check Box grid requires that you define a form and field. The field you select should be a multi select field such as a Select Boxes field type that allow a user to select one of many values.

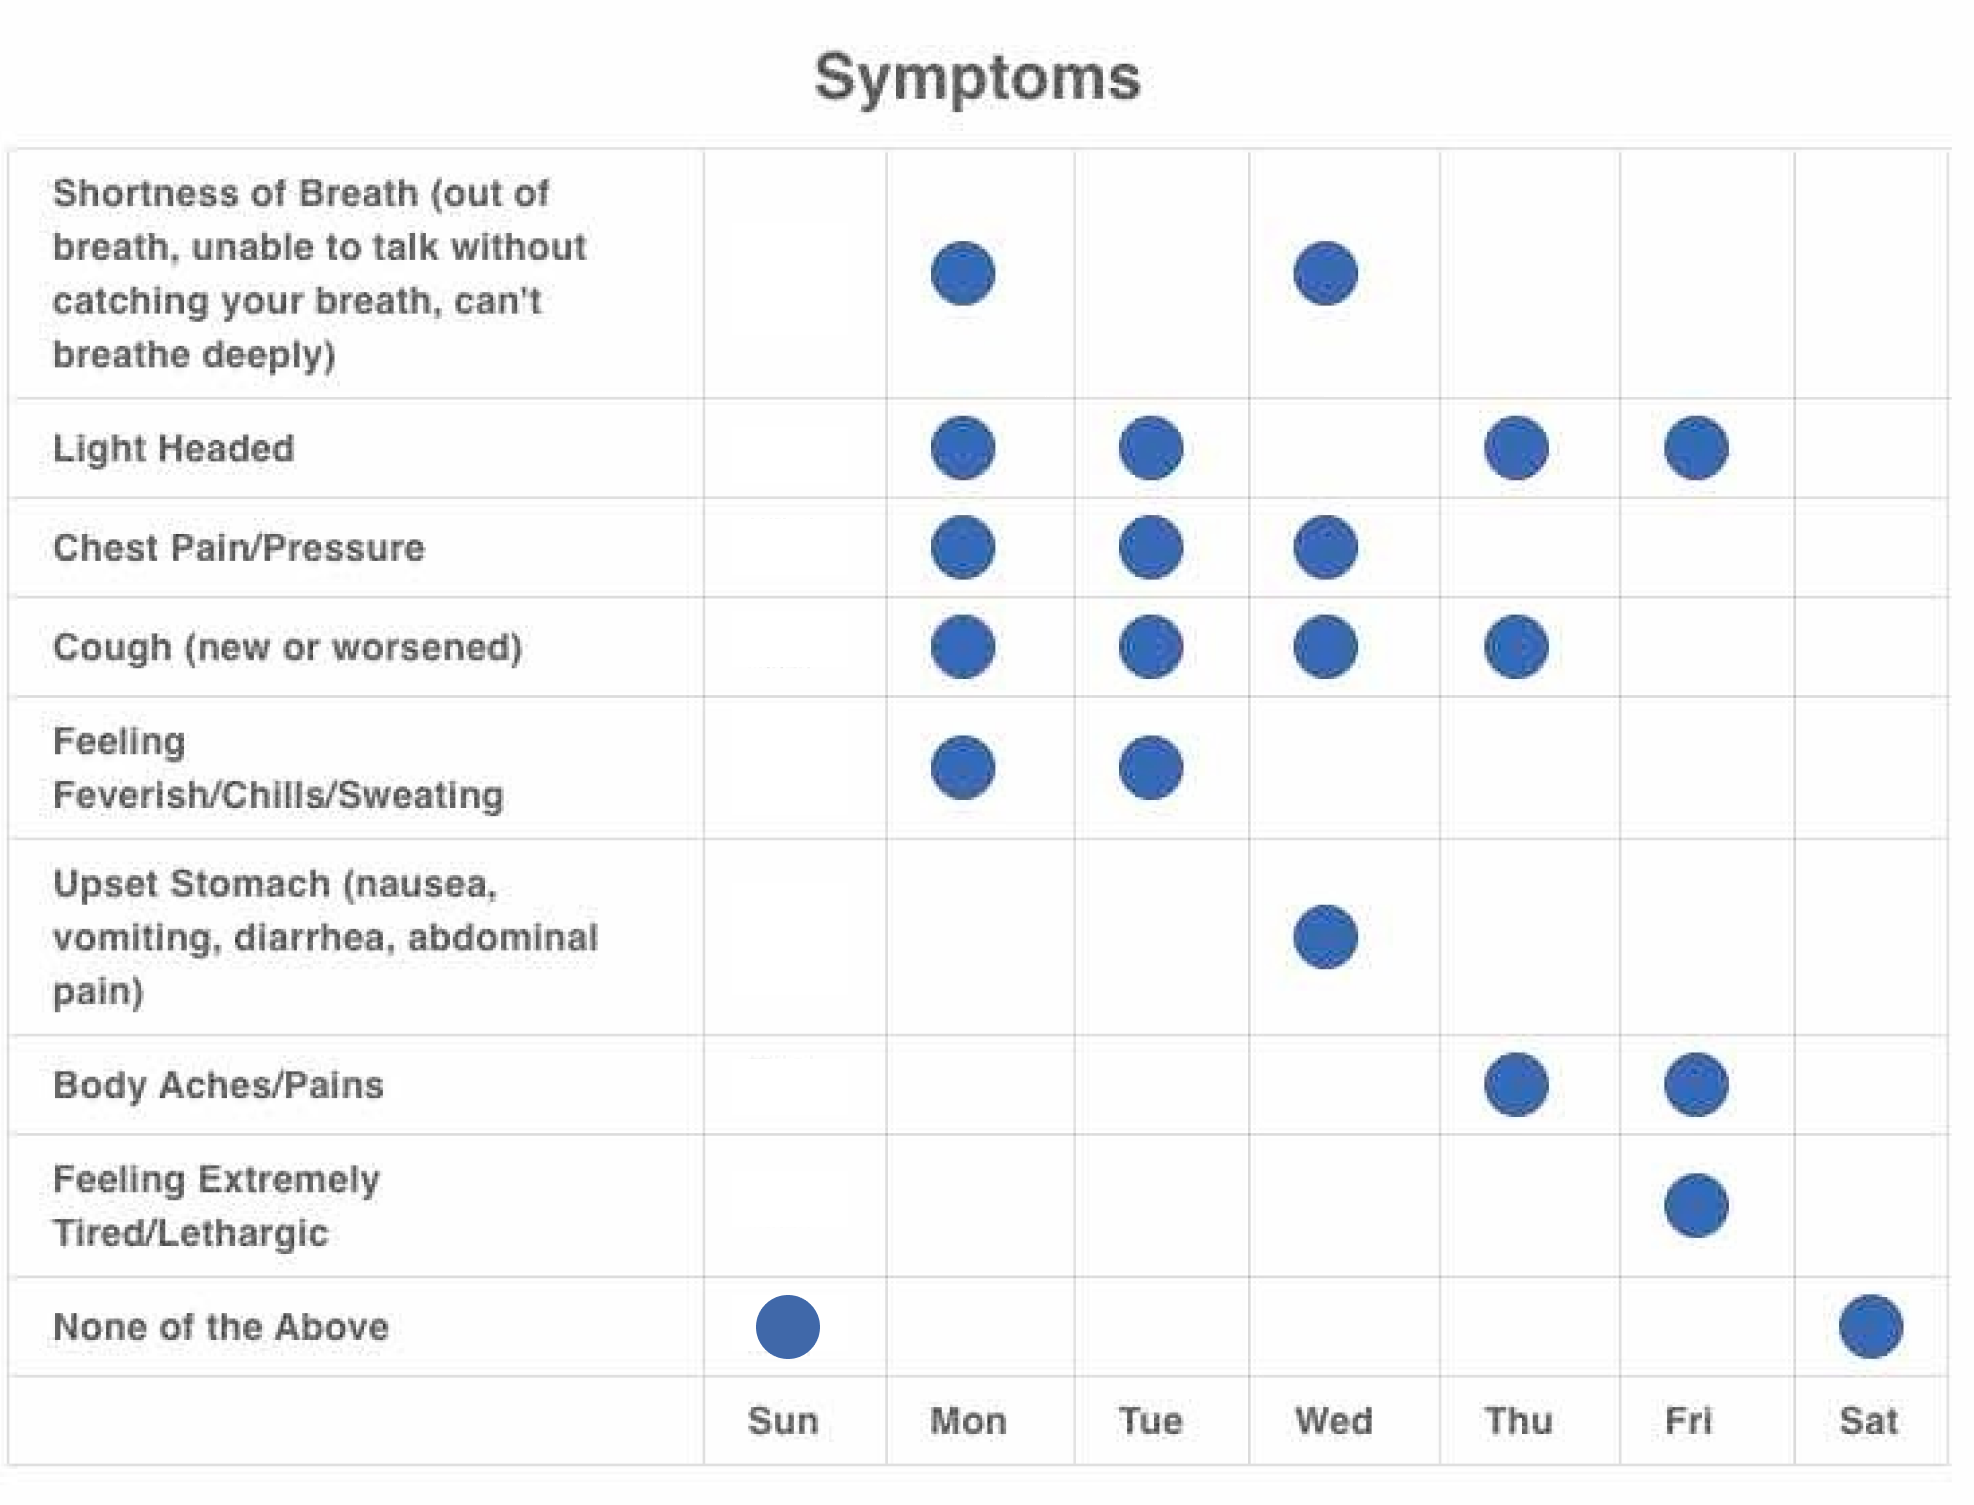
Grid
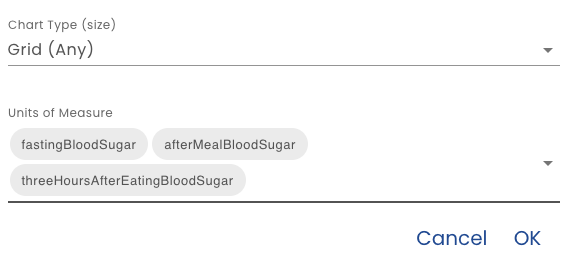
A Grid chart type is a simple table of numbers. Configuring simple requires selecting the fields to display.

View
A View allows you to specify a formatted text with data inserted by using Healix Expression Grammar. When defining a View chart type, just select the View defined in the Views section.
